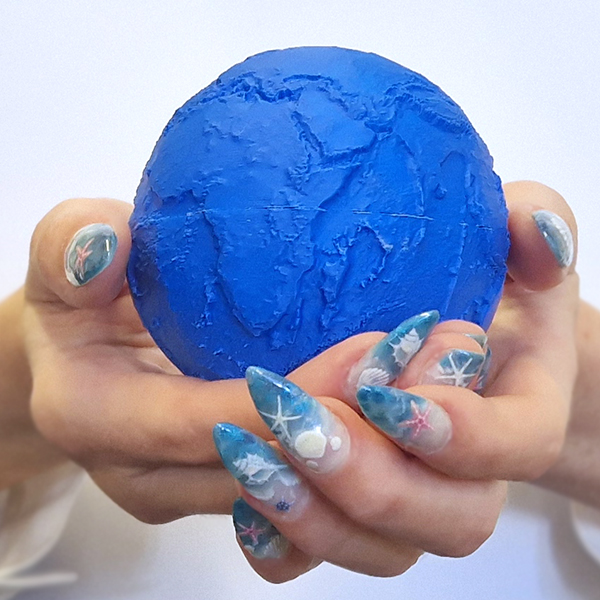
Can you hold a dataset in your hands? This may sound like a strange question, but for me, it grew out of a longer interest in how we communicate spatial information and help people connect with the places represented by data. It led me to explore data physicalisation: transforming digital data into a physical object that can be seen, handled, and experienced in a new way.
In my latest post for Inside Digital Scholarship, I show how GEBCO bathymetric data can be transformed into a raised-relief 3D globe. By turning digital elevation data into a physical model, the project explores how touch, shape, and scale can offer different ways of engaging with information.
What started as a simple idea became an opportunity to learn through making, balancing design goals, technical constraints, and practical considerations. From preparing and processing the data to designing a printable model, each stage involved decisions about what to preserve, simplify, or adapt. Choices about scale, detail, and printability all shaped the final result and highlighted how much working with data involves understanding constraints and making informed trade-offs.
It was also a good reminder that innovation doesn’t always come from large or complex projects. Sometimes it comes from having the space to experiment, follow a question, and see where it leads. In many ways, the exercise was as much about the process as the outcome: exploring possibilities, working within constraints, and learning through making.
If you’re interested in spatial data, digital scholarship, data physicalisation, or 3D printing, I hope you’ll enjoy the post.
You can read it here: Data physicalisation: from dataset to 3D globe | Inside Digital Scholarship